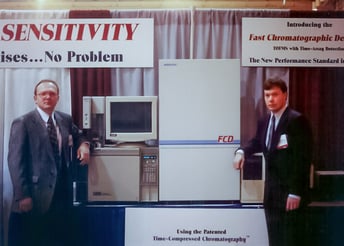
 While time-of-flight mass spectrometry (TOFMS) was first proposed in 1946, the technology simply didn't exist to allow for fast enough processing speeds to make it widely viable until 1995, when the Fast Chromatographic Detector was debuted at Pittcon. This group went on to join LECO and create the world's first commercial GC-TOFMS, the PEGASUS®, in 1997. Ever since then, technological capabilities have exploded. One-dimensional GC-TOFMS and multi-dimensional GCxGC-TOFMS are powerful and provide rich and highly informative data. If you have a number of samples to study, the volume of data produced might seem overwhelming. However, LECO's data analysis add-ons for ChromaTOF brand software, ChromaTOF Tile and ChromaTOF Sync, have once again pushed GC-TOFMS capabilities beyond what was previously feasible.Whisky provides a good example to highlight the advantages of this software. Whiskies contain hundreds of compounds at a variety of high to trace levels, that are present as a result of their fermentation, distillation, and maturation processes. This variation and complexity is what makes whiskies unique in scent and taste, and their analysis is vital for modern process control, process research and development, quality assurance, and brand protection.
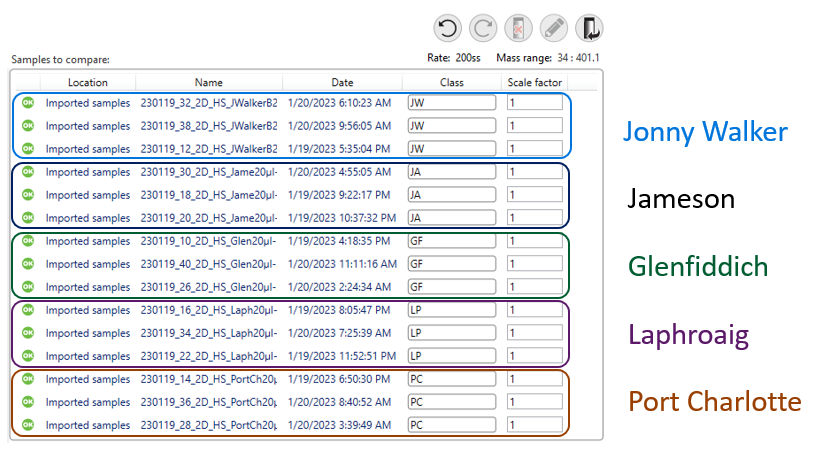
GC×GC-TOFMS is an excellent tool for characterizing a whisky sample, but the incredible resolving power and sensitivity of the Pegasus BT 4D applied to such a complex matrix can result in huge insights. But what if you have the data interpretation challenge of multiple samples? This is where an analysis tool such as ChromaTOF Tile drastically cuts data analysis times. Take, for example, the following five whiskies.
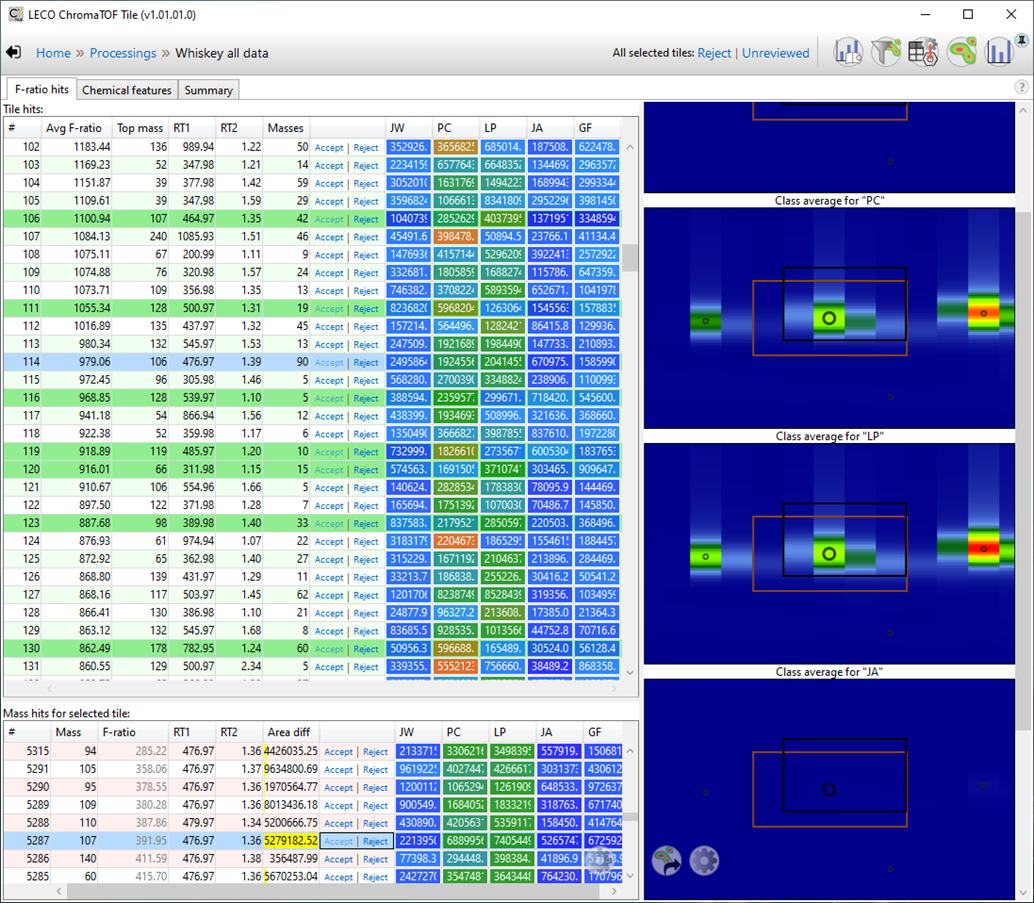
Three samples of each whisky were run through a Pegasus BT 4D and then analyzed with ChromaTOF Tile. By using tile-based Fisher-ratios, ChromaTOF Tile is able to intelligently sift through the data, identifying compounds of interest and creating heatmaps showing class averages for each set even before compounds are identified. This opens the door for new analytes of interest to be discovered and explored.
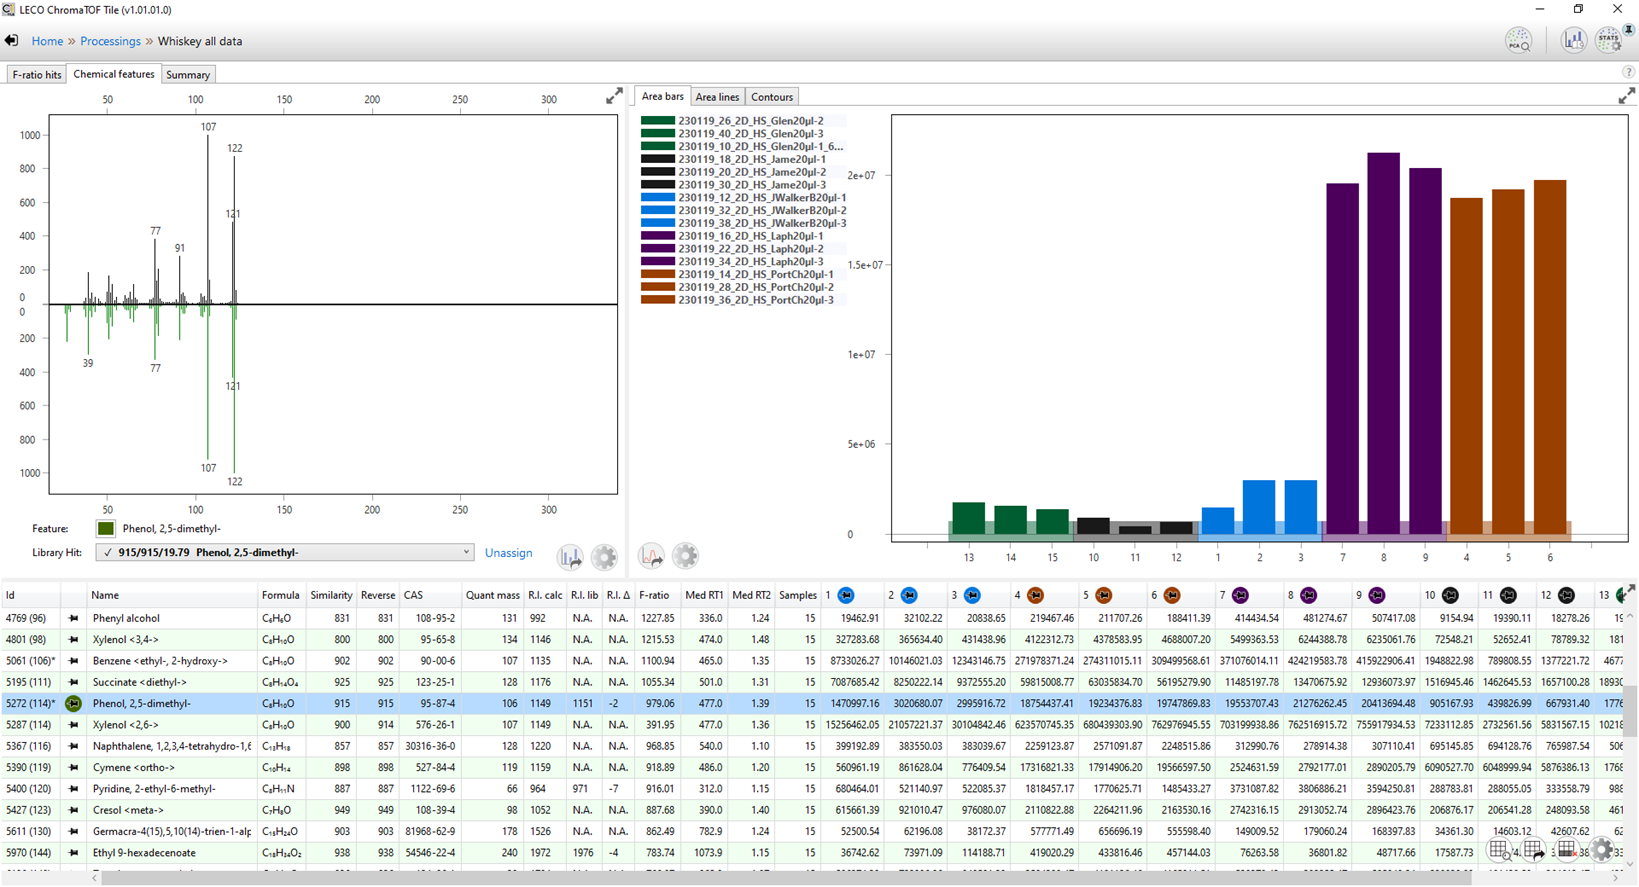
Compounds can be further analysed and identified using the "Chemical Features" pane, displaying identifications, similarity scores, and data from all of the samples grouped by set.
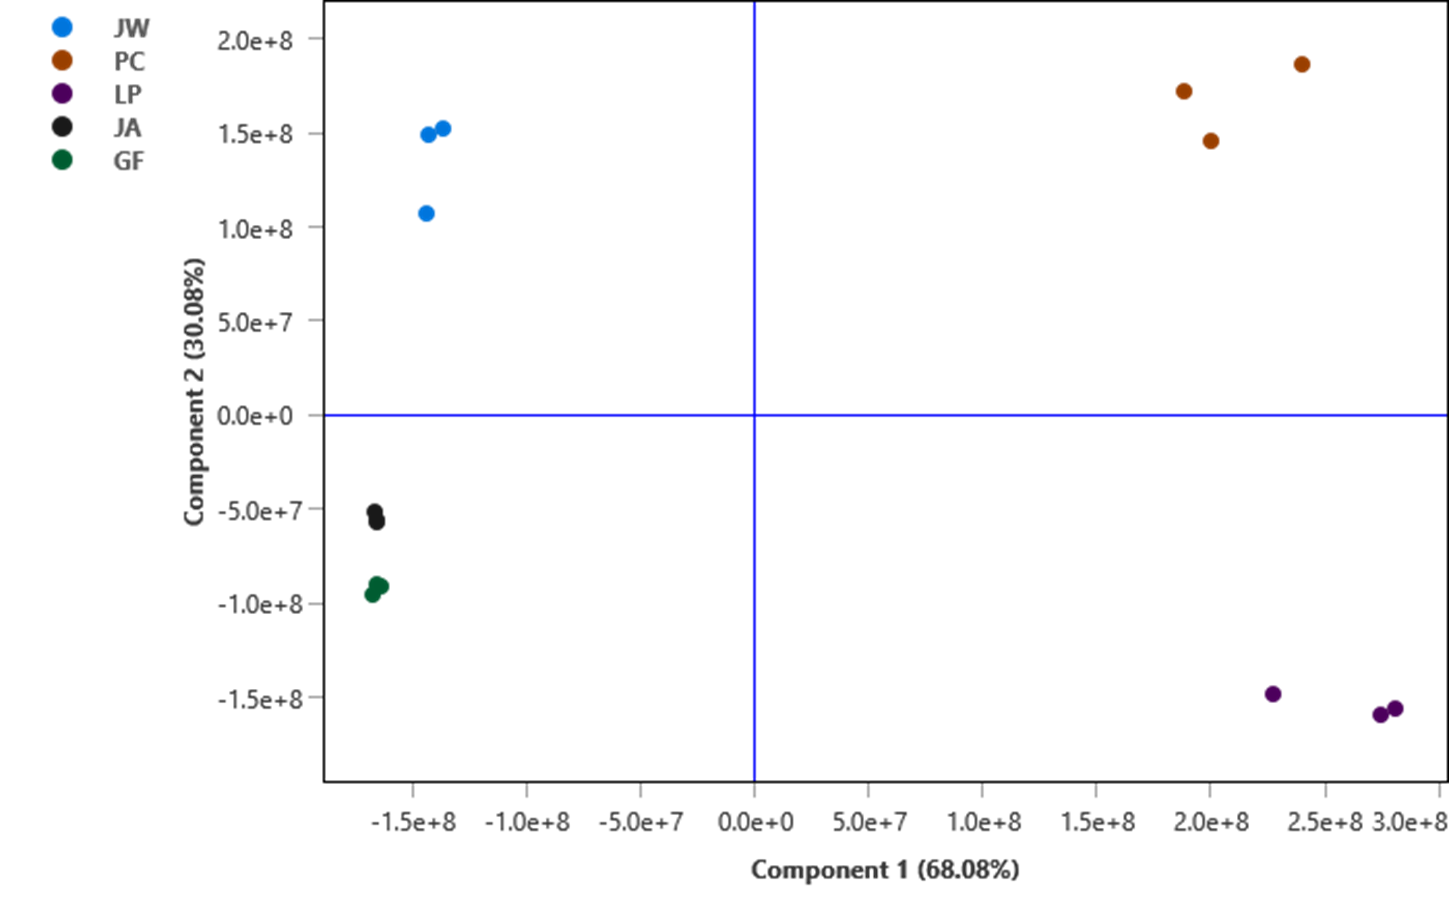
In addition, statistical analysis such as PCA plots quickly show the strong differentiation between the different whiskies.
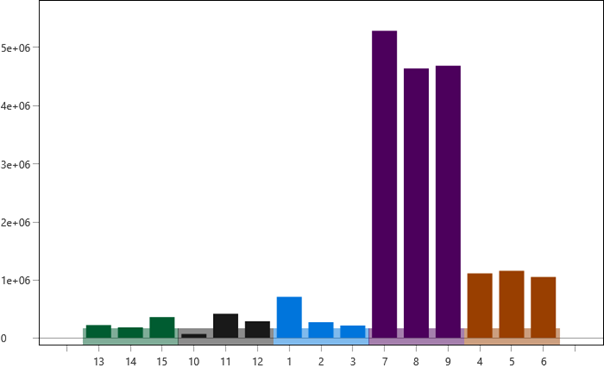
These comparisons can be analysed on a granular level. For example, out of our five whiskeys, Laphroaig is known for its smoky flavour with a surprising sweetness. The ChromaTOF Tile analysis showed that Pyridine, 2,3-dimethyl-, characterised as "coffee" and "caramellic," has a strong presence in the Laphroaig samples (below, purple) but isn't very strong in the other four types of whiskey. This difference is easily highlighted by the software and identified for further analysis.
With ChromaTOF Tile and the Pegasus BT 4D, this level of detail is available for the entire mass range of a sample, not just a few compounds, and the results can be available in minutes, not days. Let ChromaTOF Tile turn your data into chemistry and see what you've been missing. Explore a free, 90-day trial today!